Winning the World Cup, Part 2: Groups of Death
Winning the World Cup Part 2: After the Draw
Now that the draw has been made, here is the promised look at how to use it to profit in your trading. As you will recall from Part 1, I made a fantasy draw to see how we might trade that, now we will apply the same principles to the actual draw.
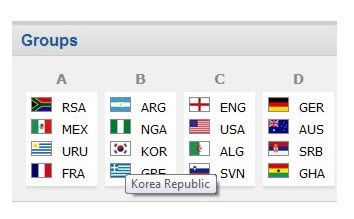
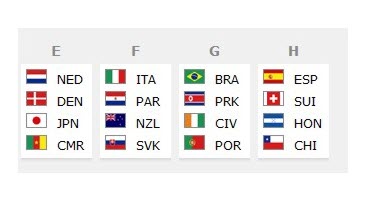
In that draw, we were able to identify at least Group of Death and some easier groups as well. So let’s remind ourselves of the actual draw:


Sure enough, it looks like there at least 2 groups here that look harder than the others. As stated in the last article, in such groups we should expect the price to lengthen on the teams involved. At first glance groups G and E seem to have won the clichéd Group of Death label, with Groups B, D and F not looking straightforward.
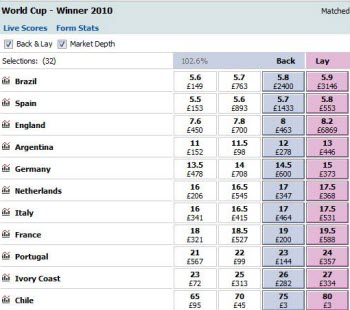
And similarly to the ‘fantasy draw’, England were handed a superb draw, even easier than the fantasy one. At least that seems to be the popular view in the media, and I have to say that when the draw came out I agreed with this. Sure enough, if we look at the current Betfair odds compared with those prior to the draw, there has been some predicable changes in prices. For instance, England’s price has narrowed from 8 to 7, while Brazil and Ivory Coast odds have lengthened from 5.8 and 26 to 6.4 and 29 respectively due to their supposedly tough draws.

But if we are to profit from our trading we sometimes need to be slightly more analytical than this. The reason that England’s group seems so easy is the presence of Algeria and Slovenia, whom many pundits have written off already.
However, rather than trust to gut instinct, lets see how we might find a more objective way of ranking the groups in order from ‘hardest’ to ‘easiest’.
One method would be to use the latest FIFA ranking to assign rankings:
[Ranking Table]
| 1 | Spain | 100 |
| 2 | Brazil | 99 |
| 3 | Netherlands | 98 |
| 4 | Italy | 97 |
| 5 | Portugal | 96 |
| 6 | Germany | 95 |
| 7 | France | 94 |
| 8 | Argentina | 93 |
| 9 | England | 92 |
| 10 | Cameroon | 90 |
| 11 | Greece | 88 |
| 12 | USA | 87 |
| 13 | Chile | 86 |
| 14 | Ivory Coast | 85 |
| 15 | Mexico | 84 |
| 16 | Switzerland | 83 |
| 17 | Serbia | 82 |
| 18 | Uruguay | 81 |
| 19 | Australia | 80 |
| 20 | Nigeria | 78 |
| 21 | Algeria | 75 |
| 22 | Denmark | 73 |
| 23 | Paraguay | 72 |
| 24 | Slovenia | 70 |
| 25 | Slovakia | 68 |
| 26 | Ghana | 67 |
| 27 | Honduras | 64 |
| 28 | Japan | 58 |
| 29 | Korea Republic | 49 |
| 30 | New Zealand | 19 |
| 31 | South Africa | 16 |
| 32 | North Korea | 15 |
We have assigned 100 points to the top team down to 1 point for the 100th ranked team; adding these for each group gives the following “degree of difficulty index”:
Group ‘Difficulty Index’ (Hardest first)
Group H 333
Group D 324
Group C 324
Group E 319
Group B 308
Group G 295
Group A 275
Group F 256
But hang on, isn’t England’s group meant to be a walk in the park, with some commentators talking of England receiving a bye to the next round. Yet according to this ranking, England’s group is not ranked 8th (easiest) or even 7th, but way up as 2nd equal with Group D. Some other surprising facts emerge:
Most pundits favourite Group of Death, Group G, is way down in the ranking at 6th place, while the hardest group is assigned to Spain’s group, Group H.
Of course, using this method as a means to assign degree of difficulty is by no means perfect: for instance, the FIFA rankings will not be able to take account of injuries suffered to the teams prior to the World Cup. Nevertheless, it does provide enough evidence to urge caution when assigning degree of difficulty on the basis of more subjective criteria.
The assigning of points according to rankings does not always reflect degree of dominance, as for example when one team has a much larger point score than the team immediately beneath it. So let’s try this exercise again, but this time assigning the actual FIFA ranking points. Doing this, gives:
| Hardest to easiest: all | |
| Group H |
4225 |
| Group G |
4054 |
| Group E |
3852 |
| Group D |
3699 |
| Group C |
3646 |
| Group B |
3574 |
| Group A |
3334 |
| Group F |
3167 |
But yet again Spain’s group is ranked hardest. However, this time the generally accepted hardest group (G) is ranked nearer the top. So this may be a slightly more accurate gauge.
But one last criticism of this method is that it might give an unduly high ranking due to the presence of the top ranked FIFA teams and not give proper weighting to the lower teams. Applying the same ranking system excluding the top ranked teams in each group gives:
| Hardest to easiest Without top 1 | |
| Group H |
2952 |
| Group C |
2879 |
| Group E |
2108 |
| Group D |
2526 |
| Group B |
4783 |
| Group G |
2878 |
| Group A |
2817 |
| Group F |
3919 |
As you will see, this more or less produces the same ranking, with one perhaps significant exception, England’s group is once more ranked 2nd hardest!
Even if one disagrees with the ranking method, it should at least urge caution before jumping to the conclusion of England place in the last 16. In particular, the record seems to indicate that all three opposing countries, particularly USA, may on their day provide a stern test for Capello’s boys. While there may be an element of “Lies, damned lies, and Statistics”, as suggested by my colleague’s article, it is certainly a tool that will allow us to make more informed decisions about our trading.
What this means for our trading is that teams placed in easier groups than commonly accepted may well have higher odds than is reflected in the actual prices. The best example of this could be Group A, which contains France and the hosts, though perhaps not Group F which has already been as an easy group. Similarly, group H might not be as easy, so could represent a could value lay opportunity of the teams that you feel are lees likely to make it beyond the group or first knock-out stage.
In the third and final part of this series on the World Cup draw, we will look more closely at how we might use the above extra information to profit in the long-term markets.


